
Execution & Market Strength Positioning Matrix (ESP)
Execution & Market Strength Positioning (ESP) Matrix is a research product designed to help our customers quickly understand a given market landscape. The ESP Matrix provides a shortlist of companies in a given market category and ranks them based on their ability to execute and their market strength.
Problem
ESPs aren’t scalable and take away form other valuable research initiatives. Identifying potential vendors for an ESP takes up significant analyst time and remains a bottleneck for scaling. We spend about 20 hours of time producing a static version of the ESP.
While popular among customers, ESPs are relatively unknown and lack brand recognition.
Companies on the “sell-side” (ie vendors) lack a medium to engage with CB Insights' “buy-side” customers.
Companies on the “buy-side” (ie corporate CB Insights customers) lack the data and validation to make strategic business decisions.
Business Goals
We wanted to digitize the creation, management, and distribution of these ESPs. In order to do so, we need to solve the following problems:
Automate ESP creation so the product can be scaled without analyst input
Maximize reach and build a brand for ESPs to promote the development of a technology marketplace
Buy-side: Need ESPs to make strategic business decisions
Sell-side: Need to be featured in ESPs to improve brand awareness
Team
Trio
Nectar (Senior Product Designer)
Product Manager
Engineer Manager
Collaboration
Research, Products and Operations (RPO) Team
Intelligence Unit (IU) Team
Marketing Team
Engineer Team
Timeline
3 months
Process
Collaborating closely with our Research, Products, and Operations (RPO) as well as the Analyst team (Intelligence Unit), we embarked on the digitization of ESP. This process involved gaining insights into every step an analyst takes to create a static ESP, a comprehensive spreadsheet. By thoroughly understanding these processes, we utilized the spreadsheets to identify areas where we could significantly enhance the speed of data digestion.
Previous Flow
Previously, ESPs were built in a linear fashion from start-to-finish, creating dependencies and bottlenecks throughout the process. This process only allows us to cover a small number of markets and makes it difficult to scale. There are four overall phases to producing an ESP - this concept will tackle #4 of this entire workflow.
Creating a long list of vendors (Research Products + IU)
Creating a short list of vendors (Research Products + IU)
Scoring the vendors (Research Products + IU)
Based on the results of scoring, work with graphic designs to create a 2x2 matrix. (IU & Design)
This is what we were tasked to improve.
Competitive Analysis
Upon receiving this project, my initial action was to acquaint myself with the existing quadrants. I extensively researched Gartner's Magic Quadrants, Forrester's Wave, and G2's Grid. Conducting an analysis, I identified successful elements, shortcomings, and potential areas for improvement for CB Insights in our new product. A significant lesson gleaned from our examination of Gartner's Magic Quadrant and Forrester's Wave was the challenge both companies faced in rapidly scaling these products.
A question that I asked for someone who hasn’t created a research product such as this is: Is a quadrant the best way we can see momentum of a list of companies in an industry?
Lo-Fidelity Designs
Main goals for MVP were:
Ability to place companies based on 4 pilars:
See key insights about for each company and to be able to take users to company’s full profile
Download feature
Screenshot ability
Be able to discover ESPs through search
I adhered to the quadrant structure by incorporating the four pillars and positioning companies within the designated areas. Additionally, I integrated a popover feature that provides brief insights about a selected company, utilizing a visual language familiar to our users.
Similar quadrants
Given our interconnected system of related industries, why not showcase similar industry quadrants? This approach would enhance user discoverability of other quadrants, encouraging them to remain on our platform for an extended period.

ESP: 1st iteration
Is it possible to facilitate interactions within the quadrant to access information without relying on a popover? I experimented with the idea of selecting a company within the quadrant and displaying the information in an iframe adjacent to it.
I tested internally if it was intuitive that users would expect the iframe to interact with the quadrant itself. Is this easier than to just a click within the company name?
After considering resource constraints and user familiarity with quickly accessing company insights, we ultimately reverted to utilizing a popover.

Launch
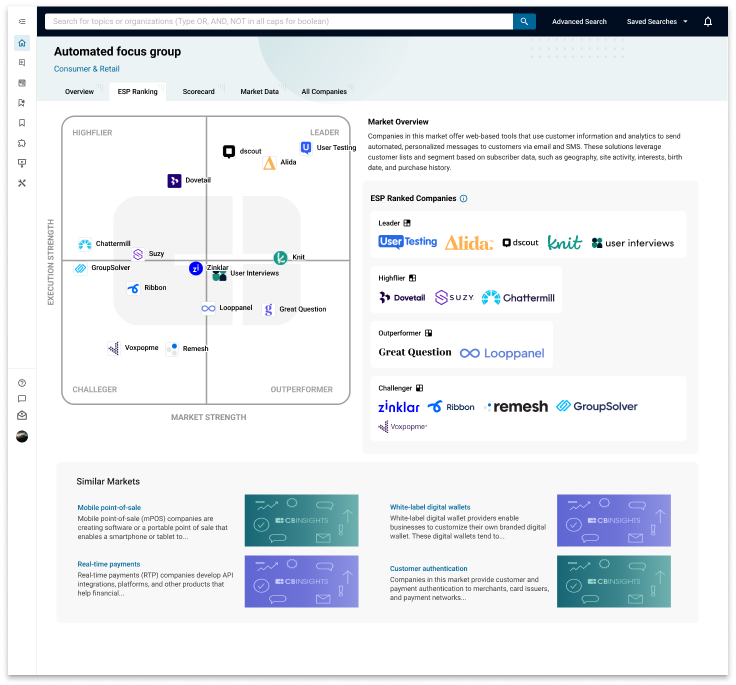
For launch we chose to use company logos instead of text. However, a challenge emerged regarding company collision within the quadrant. When companies were closely positioned on the quadrant, collisions occurred, leading to confusion about their rankings. I presented several solutions to the engineering team:
Implement dynamic text placement adjustments upon collision, shifting the text to the left, right, or aligning it to avoid overlapping.
Eliminate text entirely and replace the text with company logos, accompanied by a "key" adjacent to the quadrant for reference.

Working enhancement for dec 2024
To improve the visuals of ESP, we aimed to upgrade our current 1x1 company logos by incorporating full logos within our key. Additionally, we are in the process of including company names. Despite encountering an issue with company collision, we are currently exploring a new solution, which involves adding a white stroke around the text or company logo.
Results
We have successfully scaled the production of ESP at an accelerated pace. We were able to produce over 150 ESPs for current industries we had on our platform at launch. The time required for our analysts to generate a spreadsheet for a new industry has significantly decreased from 20 hours to just 2-4 hours. This efficiency allows us to promptly present new industry ESPs to our clients, showcasing our ability to deliver timely and valuable insights.