From Data to Decisions: A Smarter, Sharper Company Profile Experience
We redesigned Company Profiles to turn static data into strategic insights, enabling faster decisions through modular design, contextual benchmarks, and flexible layouts—launching with strong engagement and laying the groundwork for future features.
CB Insights
Senior Product Designer
2 months, ongoing
Challenge
We identified that our existing profiles were:
Too generic: Many key data points were easily found through a Google search.
Lacking narrative context: Important metrics weren’t benchmarked or explained.
Unscalable: Layouts broke with sparse or dense data, and interaction patterns varied inconsistently.
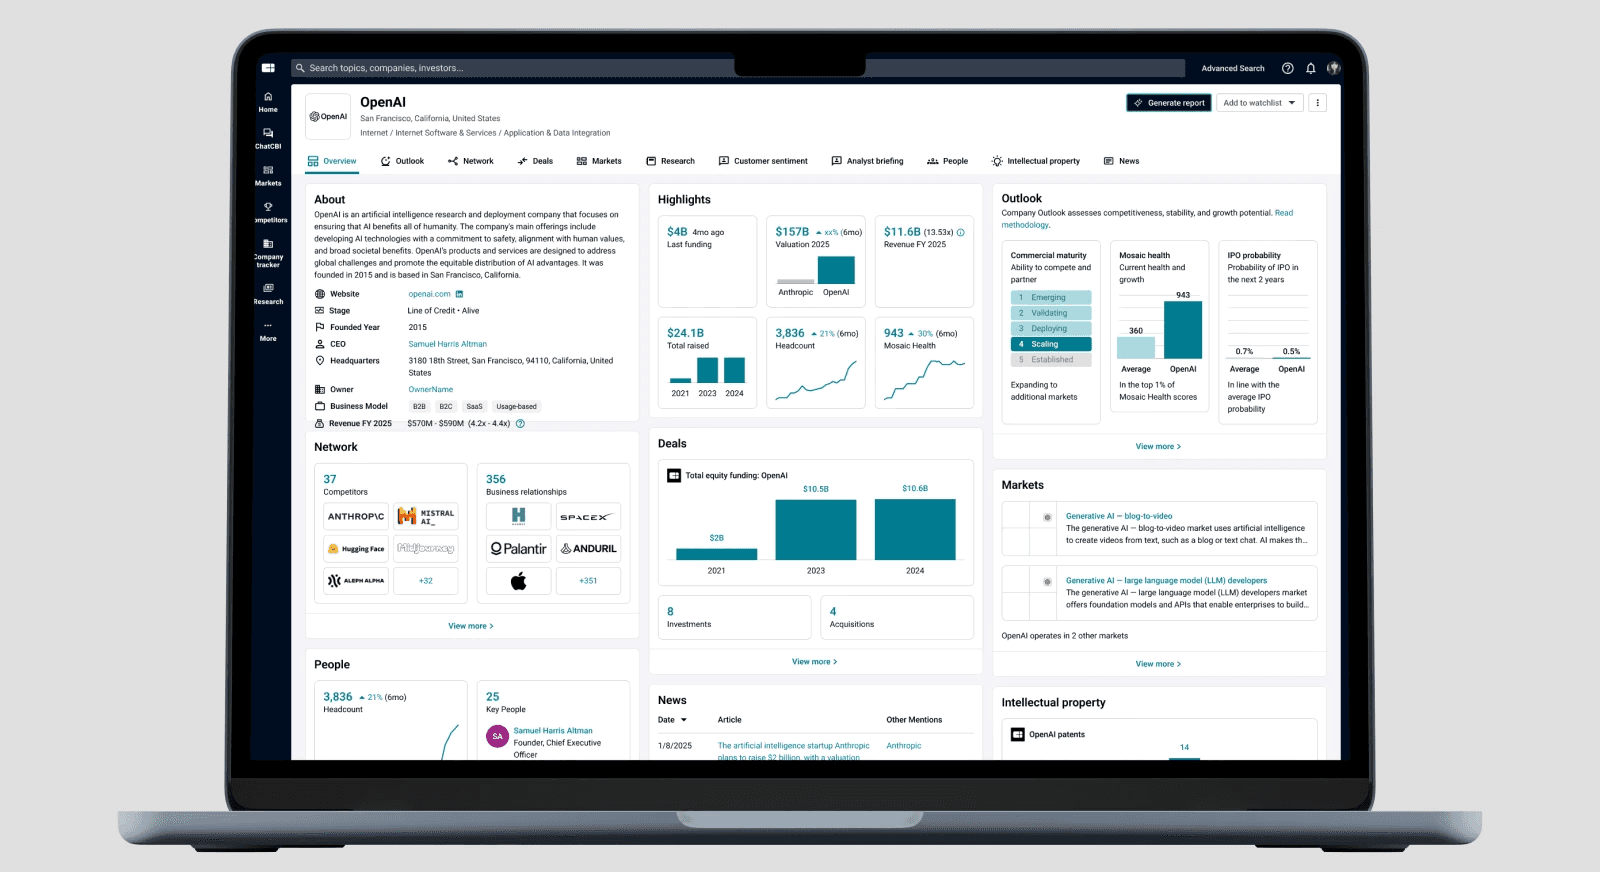
Our cross-functional goal: Redesign the Company Profile experience to emphasize relevance, context, and usability, while supporting upcoming strategic features like Scouting Reports and Outlook projections.
Results
The redesigned Overview page saw a 3x increase in internal engagement during rollout, with stakeholders praising its clarity, modularity, and narrative strength. The work laid a strong foundation for Scouting Report generation and more intelligent benchmarking, and it was delivered on time for the internal Phase 1 launch, creating clear momentum toward customer-facing improvements.
3x
increase in engagement
25%
Increase in user retention
84%
Increase in time spent on website
Process
Design goals:
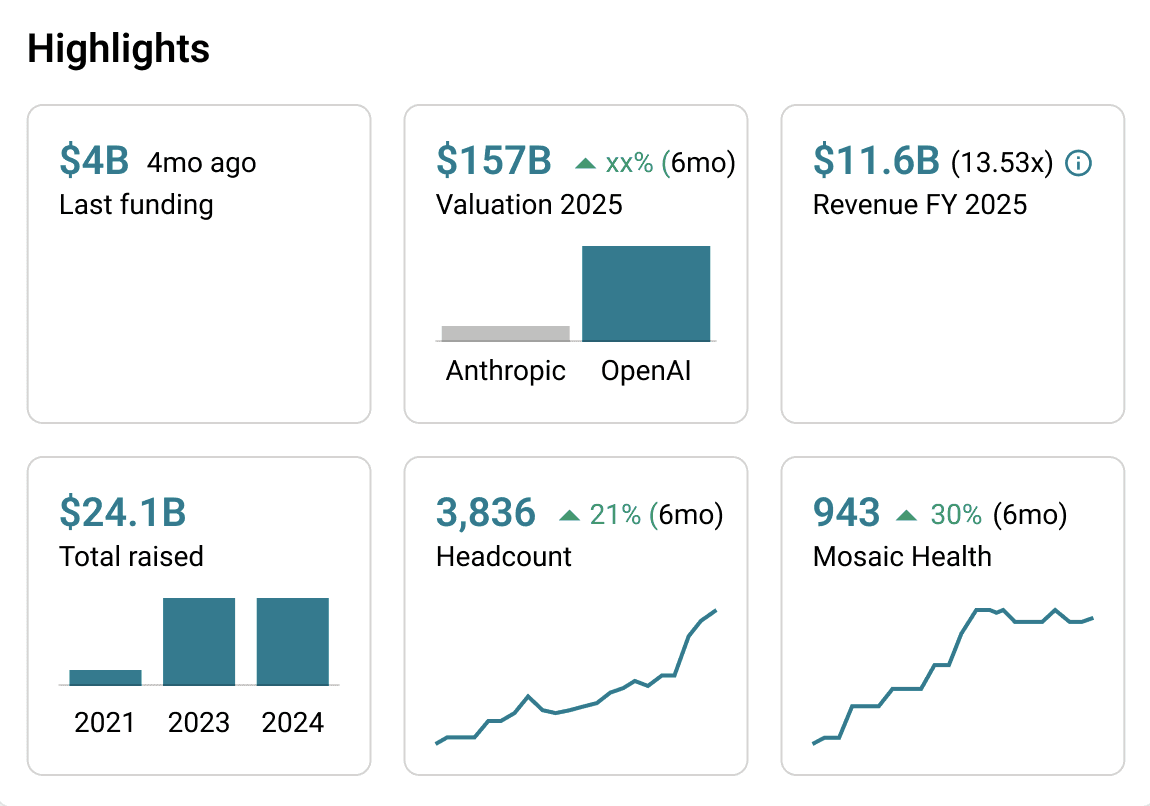
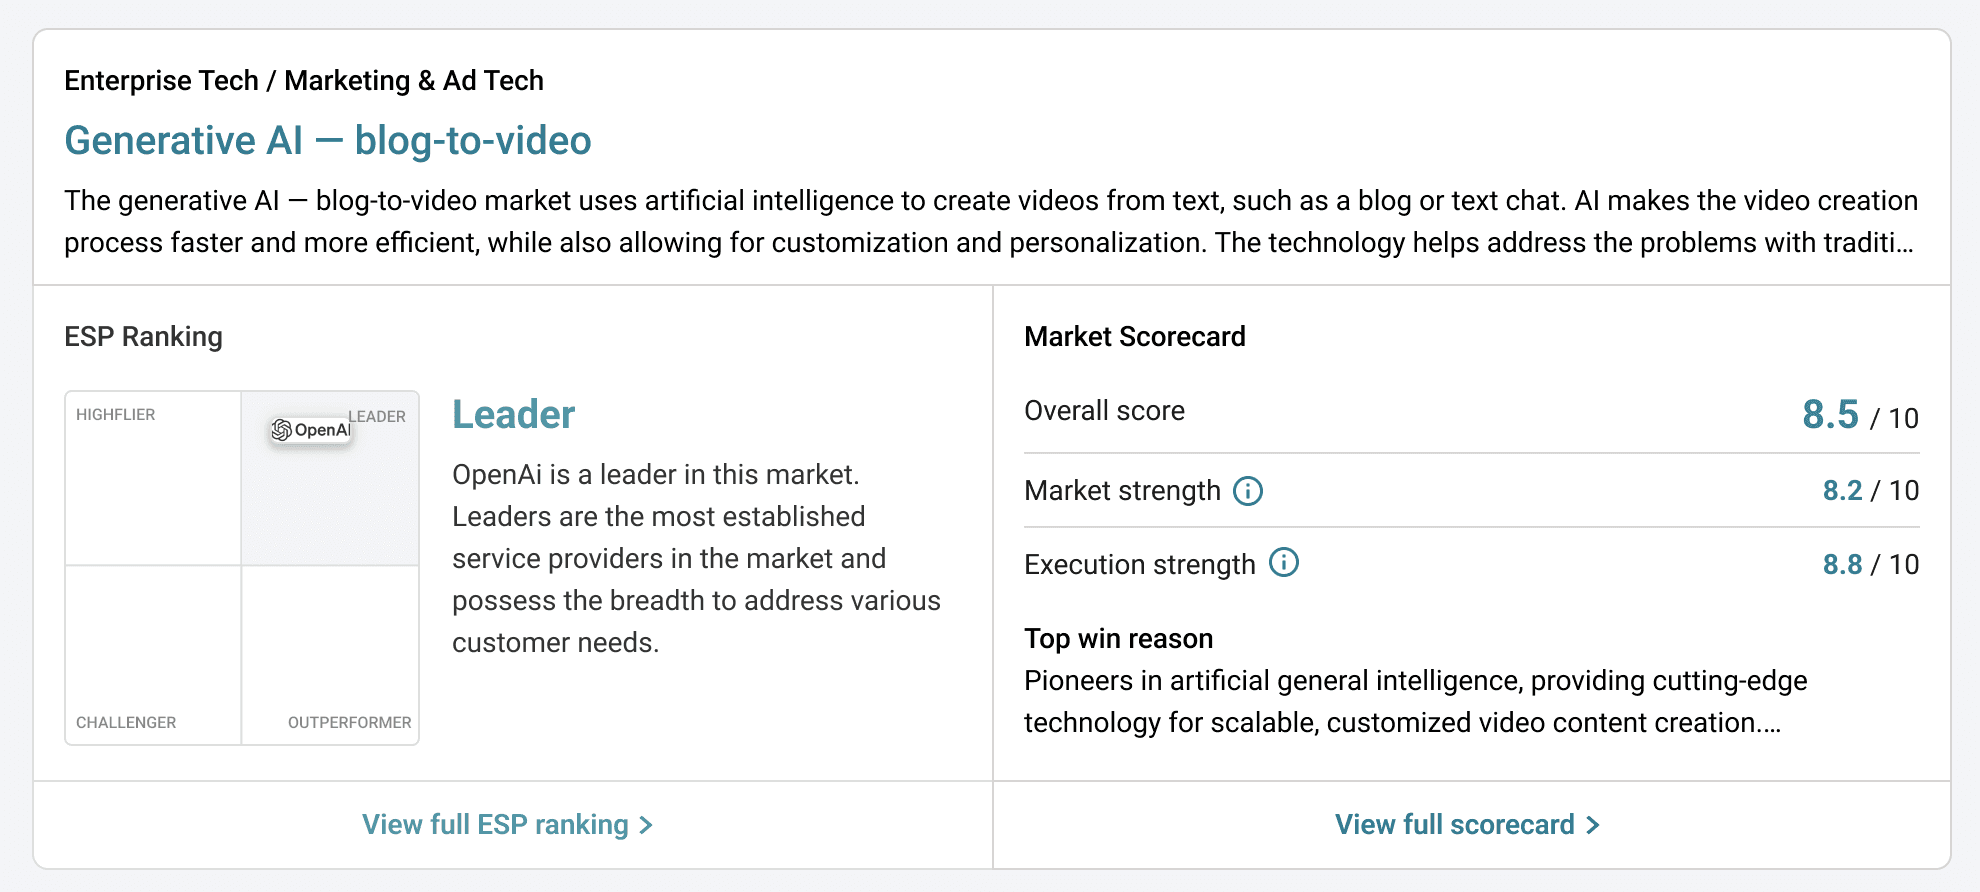
Highlight Strategic Metrics
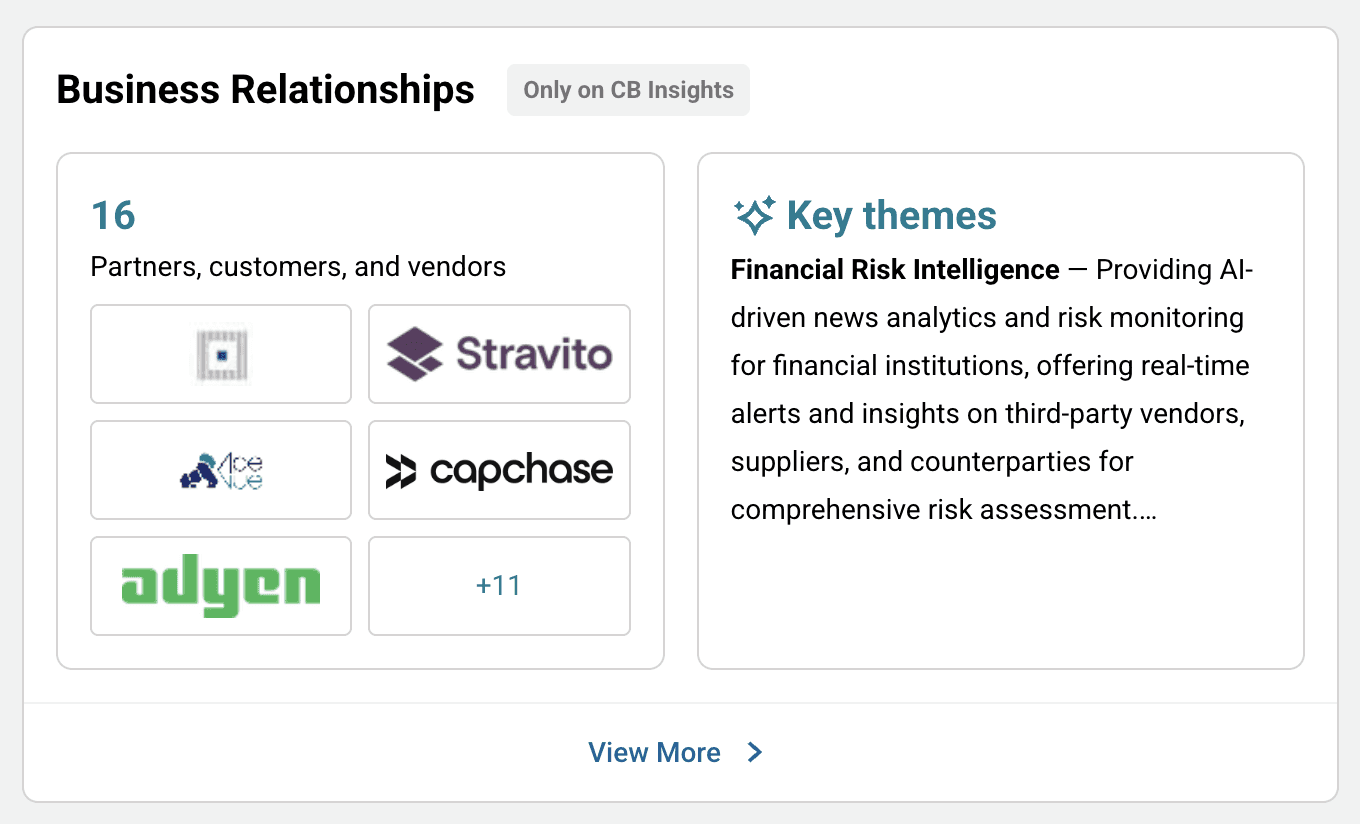
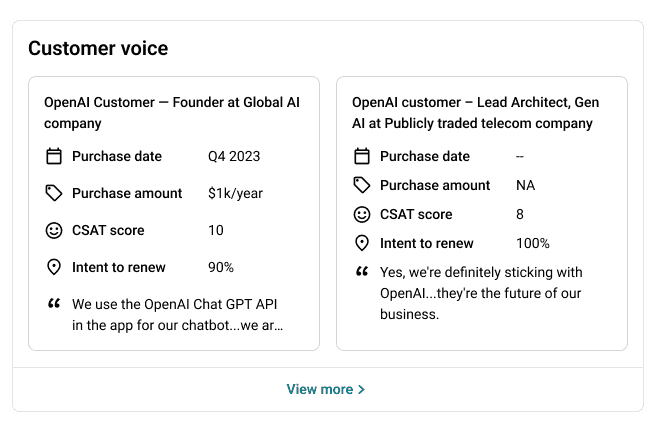
Prioritize data that drives decision-making: funding history, valuation changes, business relationships, and customer sentiment.
Make Comparisons Actionable
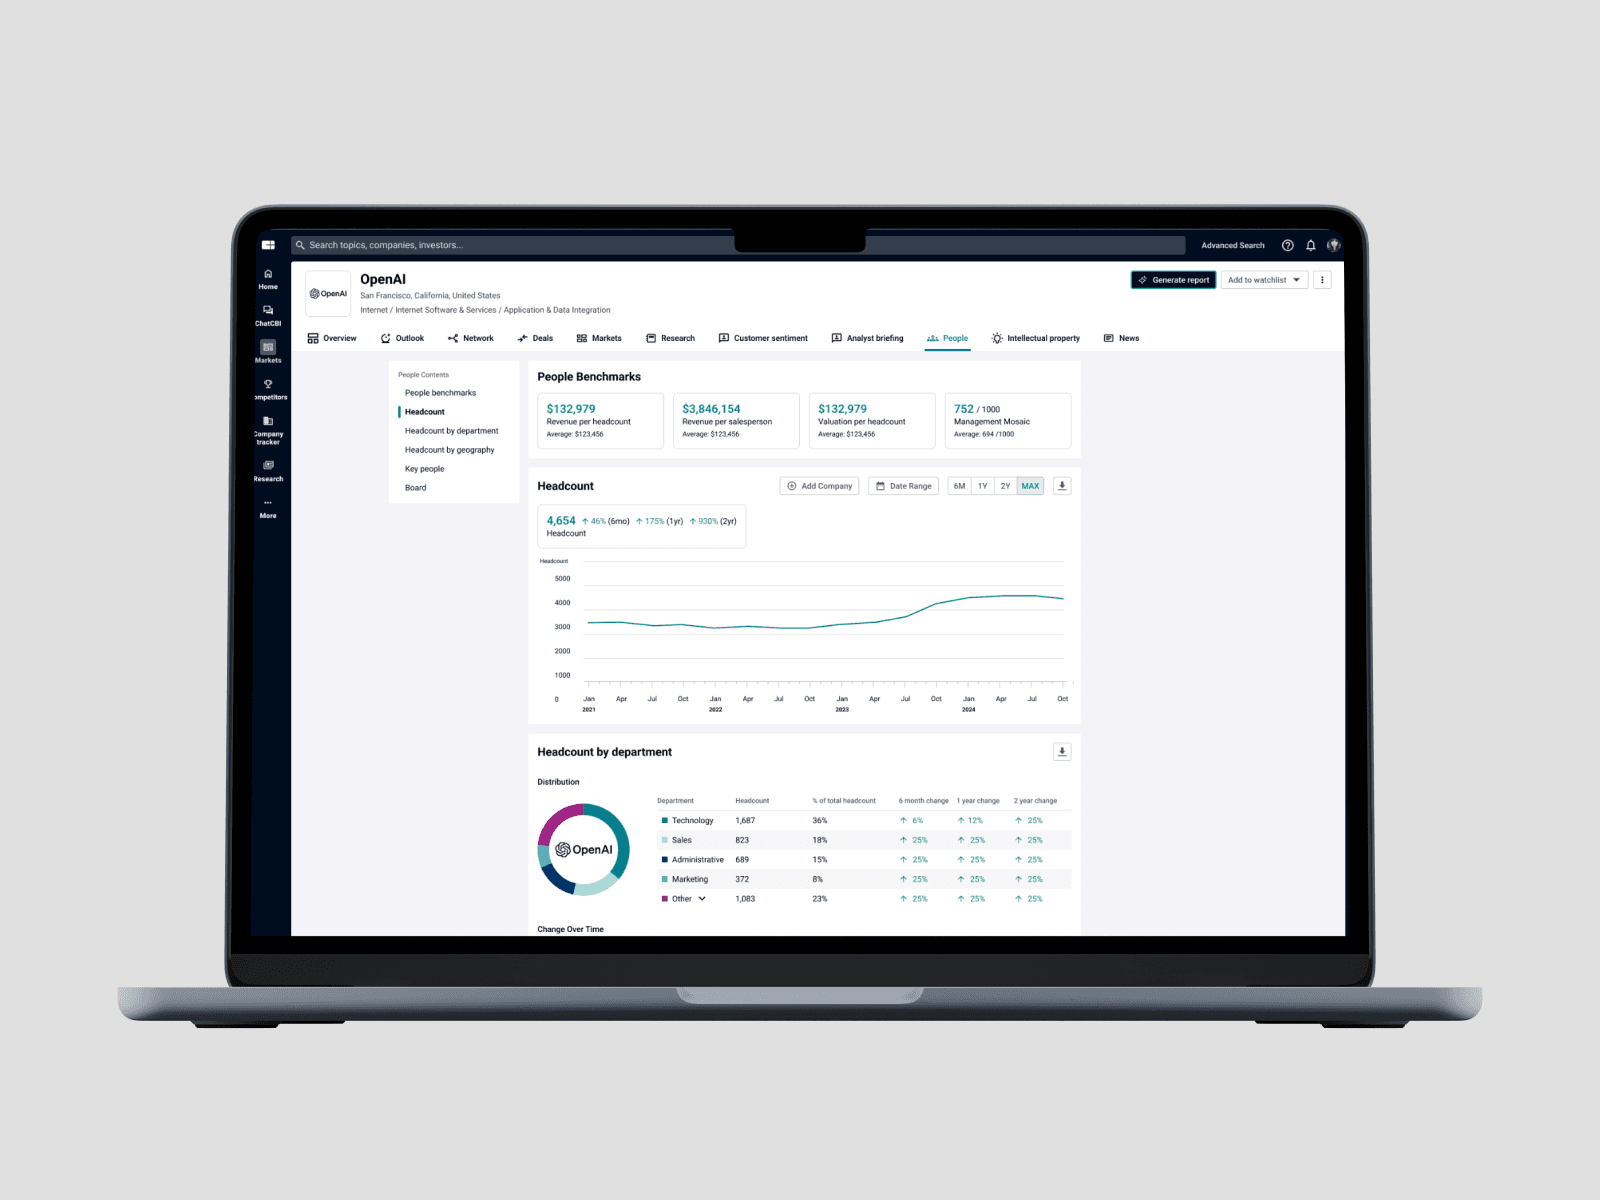
Provide intelligent benchmarking and narrative context using Mosaic scores, peer group data, and change-over-time charts.
Design for Flexibility and Density
Build a layout system that adapts gracefully to full or sparse company data, public or private status, and various content modules.
Enable Fast Scanning + Deep Dive
Structure content to support both rapid overviews and deep exploration—through widgets, tabs, and visual anchors.
Discovery & Alignment
Reviewed analytics to understand current usage patterns and drop-offs.
Partnered with PMs and stakeholders to define success metrics and business priorities.
Conducted internal interviews with power users and customer-facing teams to uncover friction points.
Audit & Decomposition
Conducted a full audit of existing company profile elements (widgets, charts, copy).
Broke down current components into reusable modules.
Mapped out where design debt and content duplication were slowing down clarity.
Experience Mapping
Developed user flows for different types of users (investor, GTM, executive).
Prioritized workflows like “What is this company?” and “How do they compare?”
Identified moments that required deep dives vs. glanceable summaries.
Concept Prototyping
Explored multiple widget-based layouts to support high/low density data scenarios.
Created low- to high-fidelity prototypes
Iterated on visual hierarchy to promote trust, scannability, and actionability.
Cross-Functional Feedback Loops
Presented early prototypes in weekly project syncs with PMs, data, and engineering.
Incorporated CEO and leadership feedback on strategic narrative, such as pushing Outlook higher and contextualizing Mosaic scores.
Design QA + Internal Rollout
Paired closely with engineers during implementation to QA component behavior across full and sparse data states.
Ran a final stakeholder demo and aligned on launch readiness.


What I learned
Speed of trust is key: Especially when surfacing complex business data—users need immediate clarity and confidence in what they’re seeing.
Comparisons must be contextual, not just quantitative: Numbers only matter when paired with explanation and relevance.
Designing for variance (not the ideal state) is critical in data-heavy environments—layouts need to work hard with little or no data.
Strategic deprioritization is a design act: Removing “googleable” metrics and focusing on what’s uniquely valuable built credibility fast.